The GitHub Innovation Graph showcases data on eight metrics about public software development activity on GitHub: Git pushes, repositories, developers, organizations, programming languages, licenses, topics, and economic collaborators. The Innovation Graph is updated quarterly with the latest data from GitHub, and the Q2 2023 release is now here for you to explore.
Feature updates
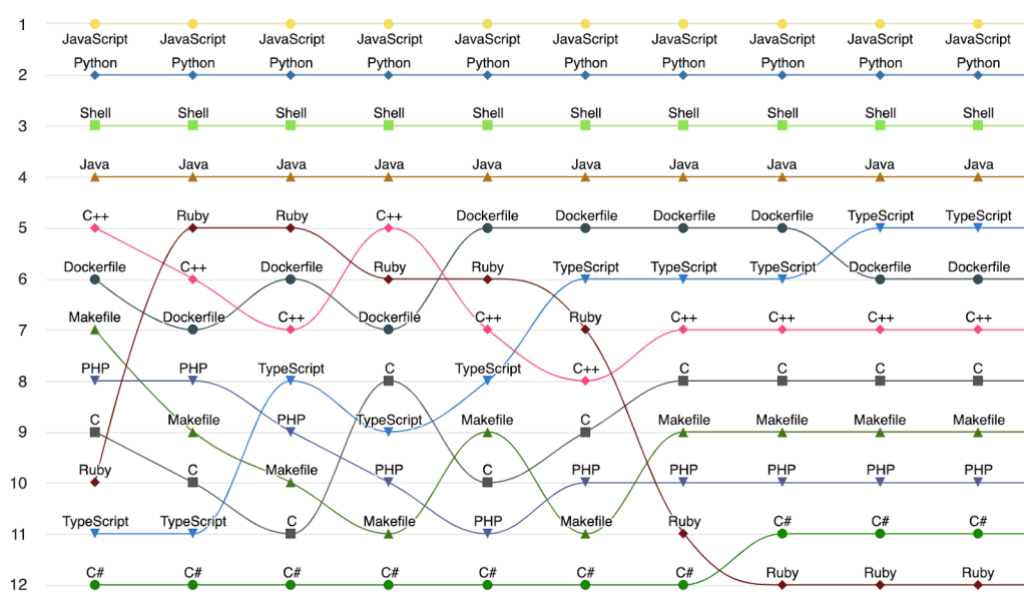
We’ve made a couple of minor quality of life updates with this release. First, we’ve updated the color for each programming language in the rankings charts to match the color listed for the language in the github-linguist/linguist repository, which should be a familiar color scheme to anyone who’s stared too long at the language statistics section of GitHub repositories:

Second, we added the name of the economy (commented out, naturally) to each chart title for better context. For example, the chart title for the number of developers in Germany is now “Developers // Germany” instead of just “Developers”:

We hope you enjoy exploring the new data in the Innovation Graph Q2 2023 release and finding new insights and trends on public software development activity on GitHub. We welcome your feedback and suggestions on improvements to the GitHub Innovation Graph, and would love to hear how you’ve used the data. Please feel free to open an Issue or Discussion with your ideas.
Also, be sure to check out other projects powered by GitHub data, from our own annual Octoverse report (video) to recent international development index releases that use GitHub activity as a component metric: the Global Innovation Index and the Network Readiness Index.


