The Nvidia RTX 4070 Ti Super officially launched on January 24, with base model cards starting at $799. Nvidia sent us a reference clocked Asus TUF Gaming for our initial launch review, and PNY sent its Verto OC — or Verto Epic-X RGB OC if you want the full name, though we’ll use the shorter description throughout this review. This will show what a minor factory overclock can provide, and as you can guess there’s plenty of RGB, so it’s priced $50 higher at $849. There’s no Founders Edition for the 4070 Ti Super, leaving it to the add-in board (AIB) partners to fight it out for supremacy and a place among the best graphics cards.
There are plenty of other reference clocked and factory overclocked cards — check our list of all the RTX 4070 Ti Super cards — and we can expect the usual RGB blinged-out models and larger coolers, as well as perhaps some smaller offerings. PNY usually takes a more conservative approach, or at least it has in the past, but the latest Verto OC designs are starting to include quite a bit of RGB.
Here’s a quick look at the specs for the various GPUs, truncated as this is a third-party follow-up review. Check the full launch review and the GPU benchmarks hierarchy for additional details.
| Graphics Card | PNY RTX 4070 Ti Super | RTX 4070 The Super | RTX 4080 | RTX 4070 Ti | RTX 4070 Super | RTX 4070 | RX 7900 XTX | RX 7900 XT | RX 7800 XT | RX 7700 XT |
|---|---|---|---|---|---|---|---|---|---|---|
| Architecture | AD103 | AD103 | AD103 | AD104 | AD104 | AD104 | Navi 31 | Navi 31 | Navi 32 | Navi 32 |
| Process Technology | TSMC 4N | TSMC 4N | TSMC 4N | TSMC 4N | TSMC 4N | TSMC 4N | TSMC N5 + N6 | TSMC N5 + N6 | TSMC N5 + N6 | TSMC N5 + N6 |
| Transistors (Billion) | 45.9 | 45.9 | 45.9 | 35.8 | 32 | 32 | 45.6 + 6x 2.05 | 45.6 + 5x 2.05 | 28.1 + 4x 2.05 | 28.1 + 3x 2.05 |
| Die size (mm^2) | 378.6 | 378.6 | 378.6 | 294.5 | 294.5 | 294.5 | 300 + 225 | 300 + 225 | 200 + 150 | 200 + 113 |
| SMs / CUs / Xe-Cores | 66 | 66 | 76 | 60 | 56 | 46 | 96 | 84 | 60 | 54 |
| GPU Cores (Shaders) | 8448 | 8448 | 9728 | 7680 | 7168 | 5888 | 6144 | 5376 | 3840 | 3456 |
| Tensor / AI Cores | 264 | 264 | 304 | 240 | 224 | 184 | 192 | 168 | 120 | 108 |
| Ray Tracing Cores | 66 | 66 | 76 | 60 | 56 | 46 | 96 | 84 | 60 | 54 |
| Boost Clock (MHz) | 2655 | 2610 | 2505 | 2610 | 2475 | 2475 | 2500 | 2400 | 2430 | 2544 |
| VRAM Speed (Gbps) | 21 | 21 | 22.4 | 21 | 21 | 21 | 20 | 20 | 19.5 | 18 |
| VRAM (GB) | 16 | 16 | 16 | 12 | 12 | 12 | 24 | 20 | 16 | 12 |
| VRAM Bus Width | 256 | 256 | 256 | 192 | 192 | 192 | 384 | 320 | 256 | 192 |
| L2 / Infinity Cache | 64 | 64 | 64 | 48 | 48 | 36 | 96 | 80 | 64 | 48 |
| Render Output Units | 96 | 96 | 112 | 80 | 80 | 64 | 192 | 192 | 96 | 96 |
| Texture Mapping Units | 264 | 264 | 304 | 240 | 224 | 184 | 384 | 336 | 240 | 216 |
| TFLOPS FP32 (Boost) | 44.9 | 44.1 | 48.7 | 40.1 | 35.5 | 29.1 | 61.4 | 51.6 | 37.3 | 35.2 |
| TFLOPS FP16 (FP8) | 359 (718) | 353 (706) | 390 (780) | 321 (641) | 284 (568) | 233 (466) | 122.8 | 103.2 | 74.6 | 70.4 |
| Bandwidth (GBps) | 672 | 672 | 717 | 504 | 504 | 504 | 960 | 800 | 624 | 432 |
| TDP (watts) | 285 | 285 | 320 | 285 | 220 | 200 | 355 | 315 | 263 | 245 |
| Launch Date | Jan 2024 | Jan 2024 | Nov 2022 | Jan 2023 | Jan 2024 | Apr 2023 | Dec 2022 | Dec 2022 | Sep 2023 | Sep 2023 |
| Launch Price | $849 | $799 | $1,199 | $799 | $599 | $599 | $999 | $899 | $499 | $449 |
| Online Price | $850 | $800 | $1,160 | $742 | $600 | $535 | $945 | $720 | $500 | $440 |
The only real difference in terms of specs between the PNY Verto OC and the reference 4070 Ti Super comes from the small 45 MHz bump in boost clock. On paper that’s a 1.7% increase, though there are other factors as well. TGP is the same 285W, as far as we’re aware, but the cooler, fans, VRMs, and other elements can all have a knock-on effect.
There shouldn’t be any major changes in overall performance, and we won’t spend a ton of time analyzing the results as they mostly speak for themselves, but let’s take a closer look at the PNY card itself before hitting the benchmarks.
PNY RTX 4070 Ti Super Verto OC
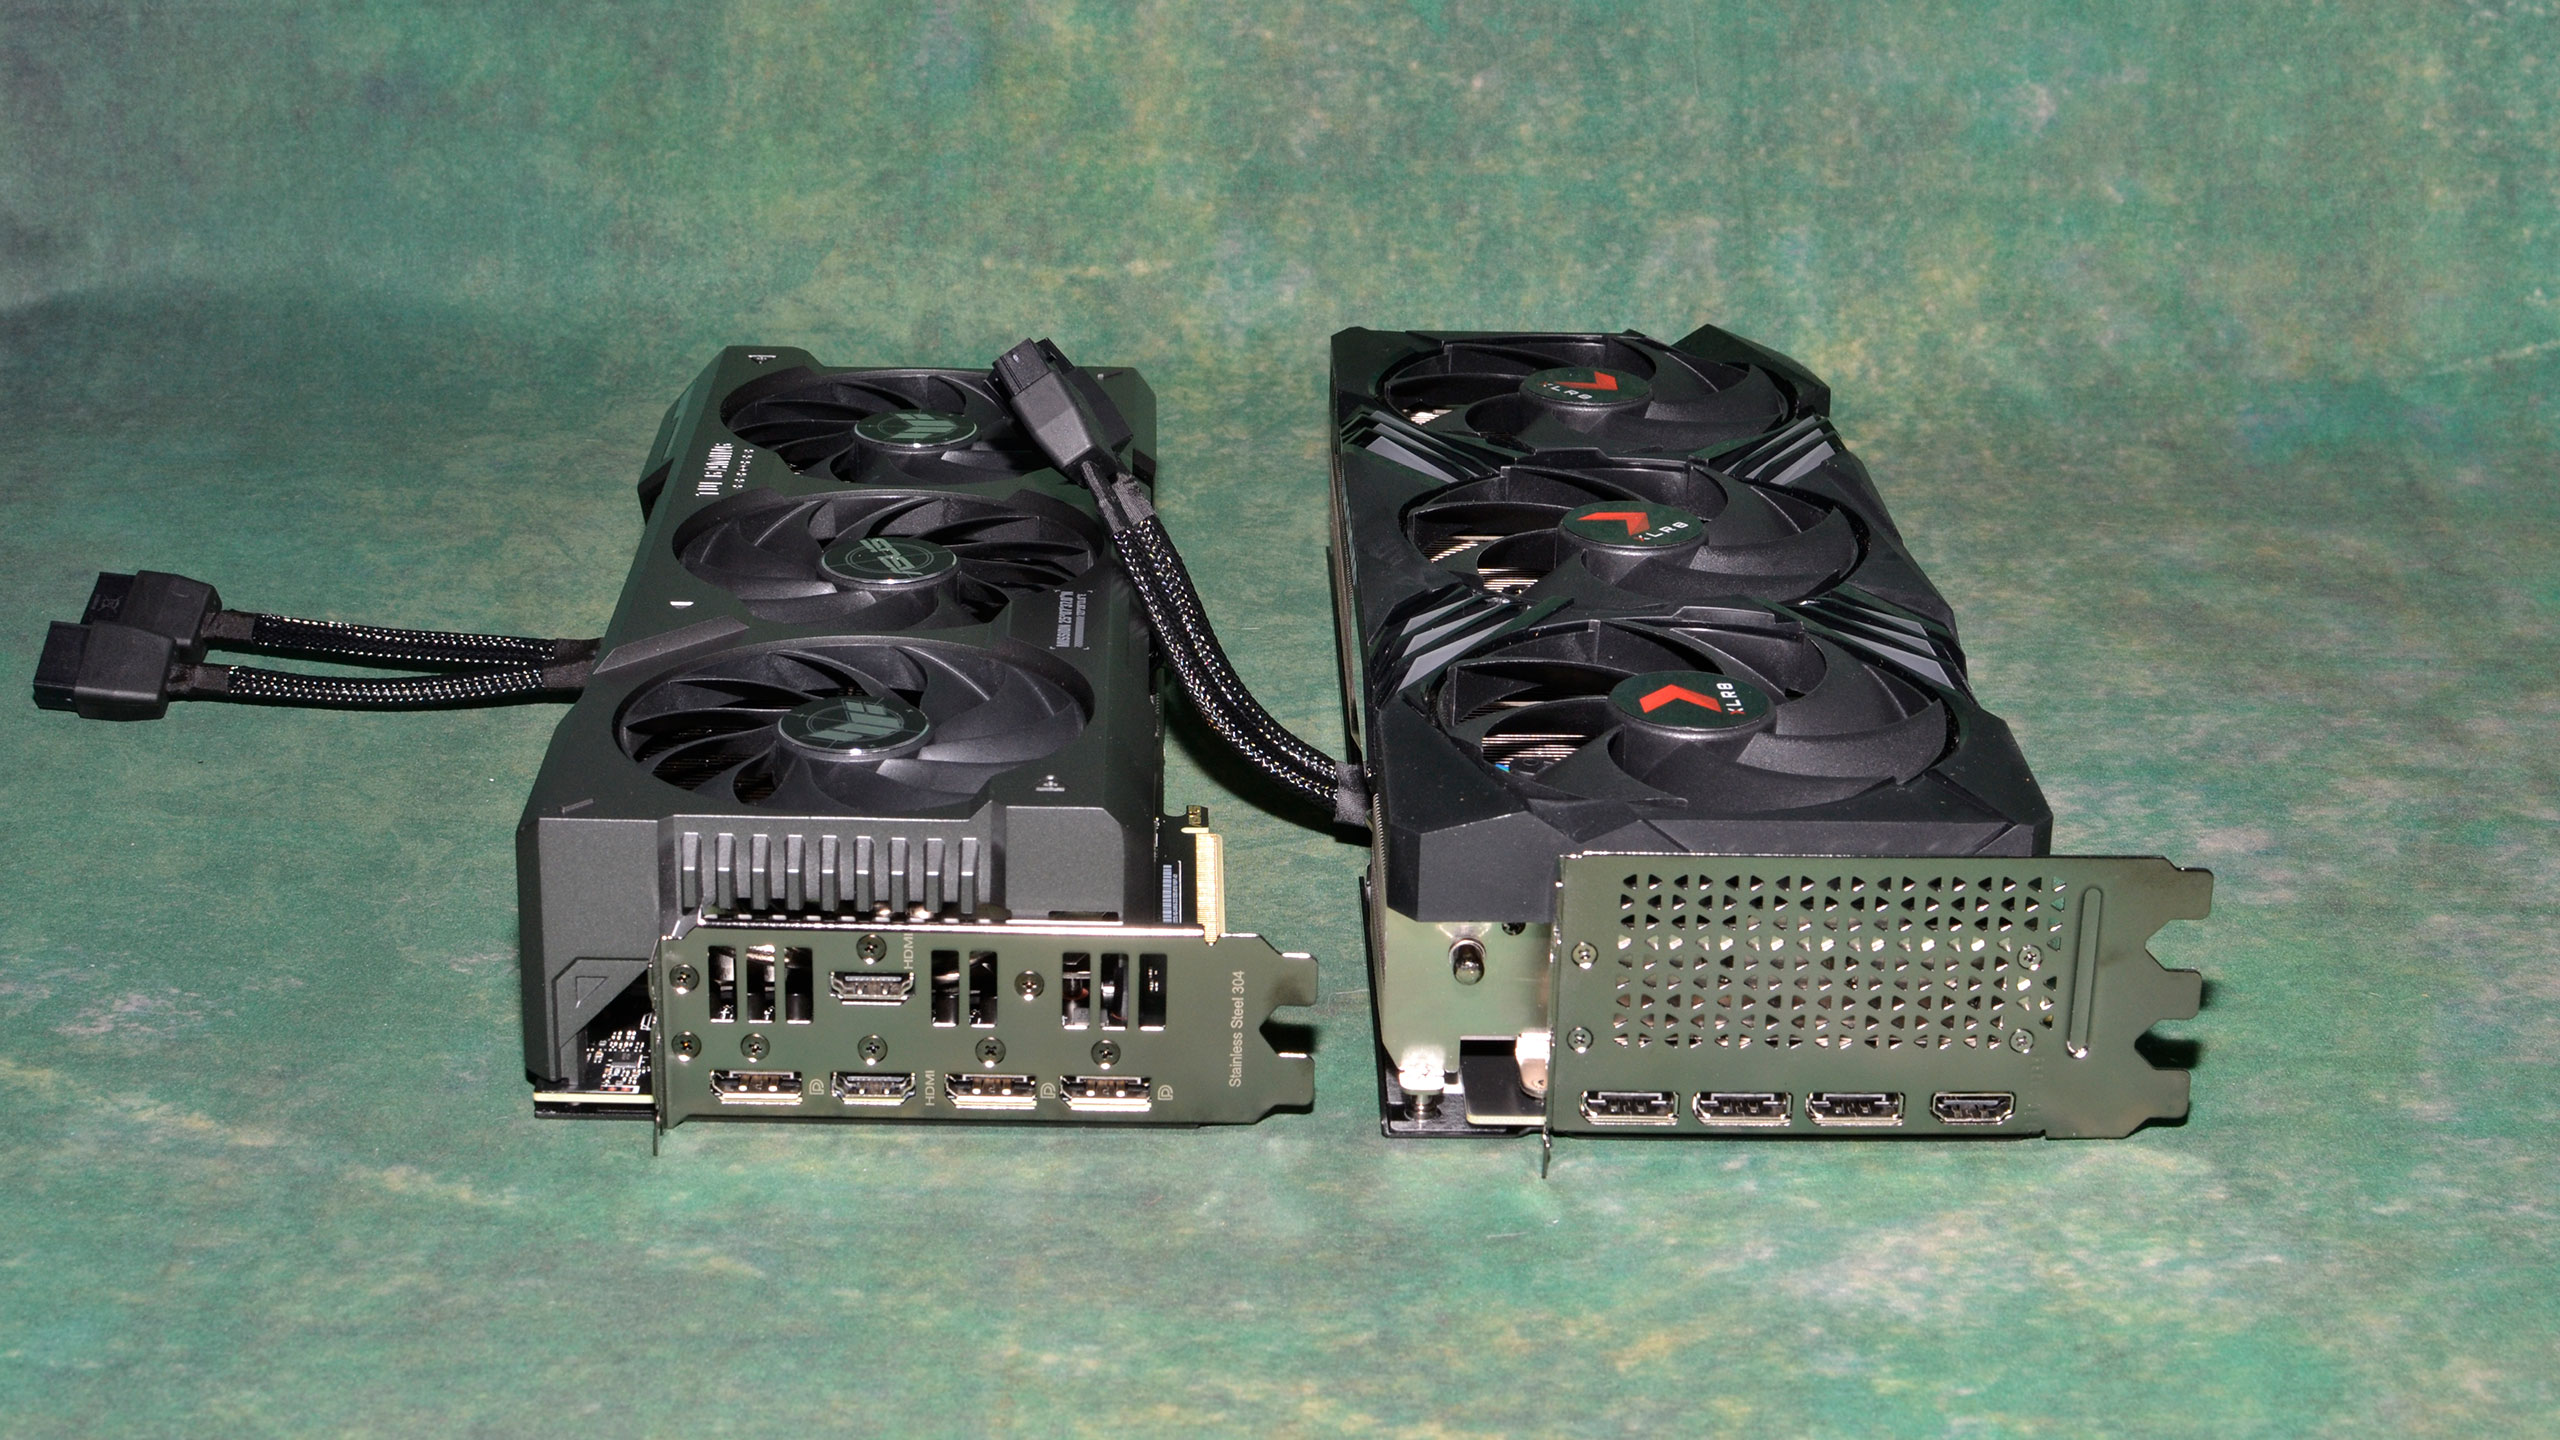
First looks don’t suggest anything unusual for the PNY Verto OC. It’s a larger card, measuring 333x134x64 mm (our measurements), and weighing 1547g. That’s close in dimensions to the Asus TUF Gaming we looked at for the launch review, except the PNY card is about 3cm longer and weighs 224g more. Both are slightly wider than a 3-slot width and will basically occupy four slots.
PNY also uses different fans, and this goes along with the potentially improved cooling performance. There are three 98mm fans, with the integrated rims that we like to see on modern graphics cards. That extra centimeter in diameter should mean more airflow and lower temperatures, and our test results on page five will confirm that.
The difference in weight could be due to a better cooler in theory, but more likely is that the larger fans plus the full 3-slot IO bracket account for most of that weight. There’s also the materials and construction of the cooling shroud and RGB lighting that could account for at least a bit of weight.
PNY currently lists two different 4070 Ti Super variants: the Verto OC we’re looking at includes full RGB lighting, while the regular Verto only has a 15 MHz factory OC, a slightly thinner cooler, and rim-less fans. It probably works fine, but we definitely appreciate the extras on the Verto OC.
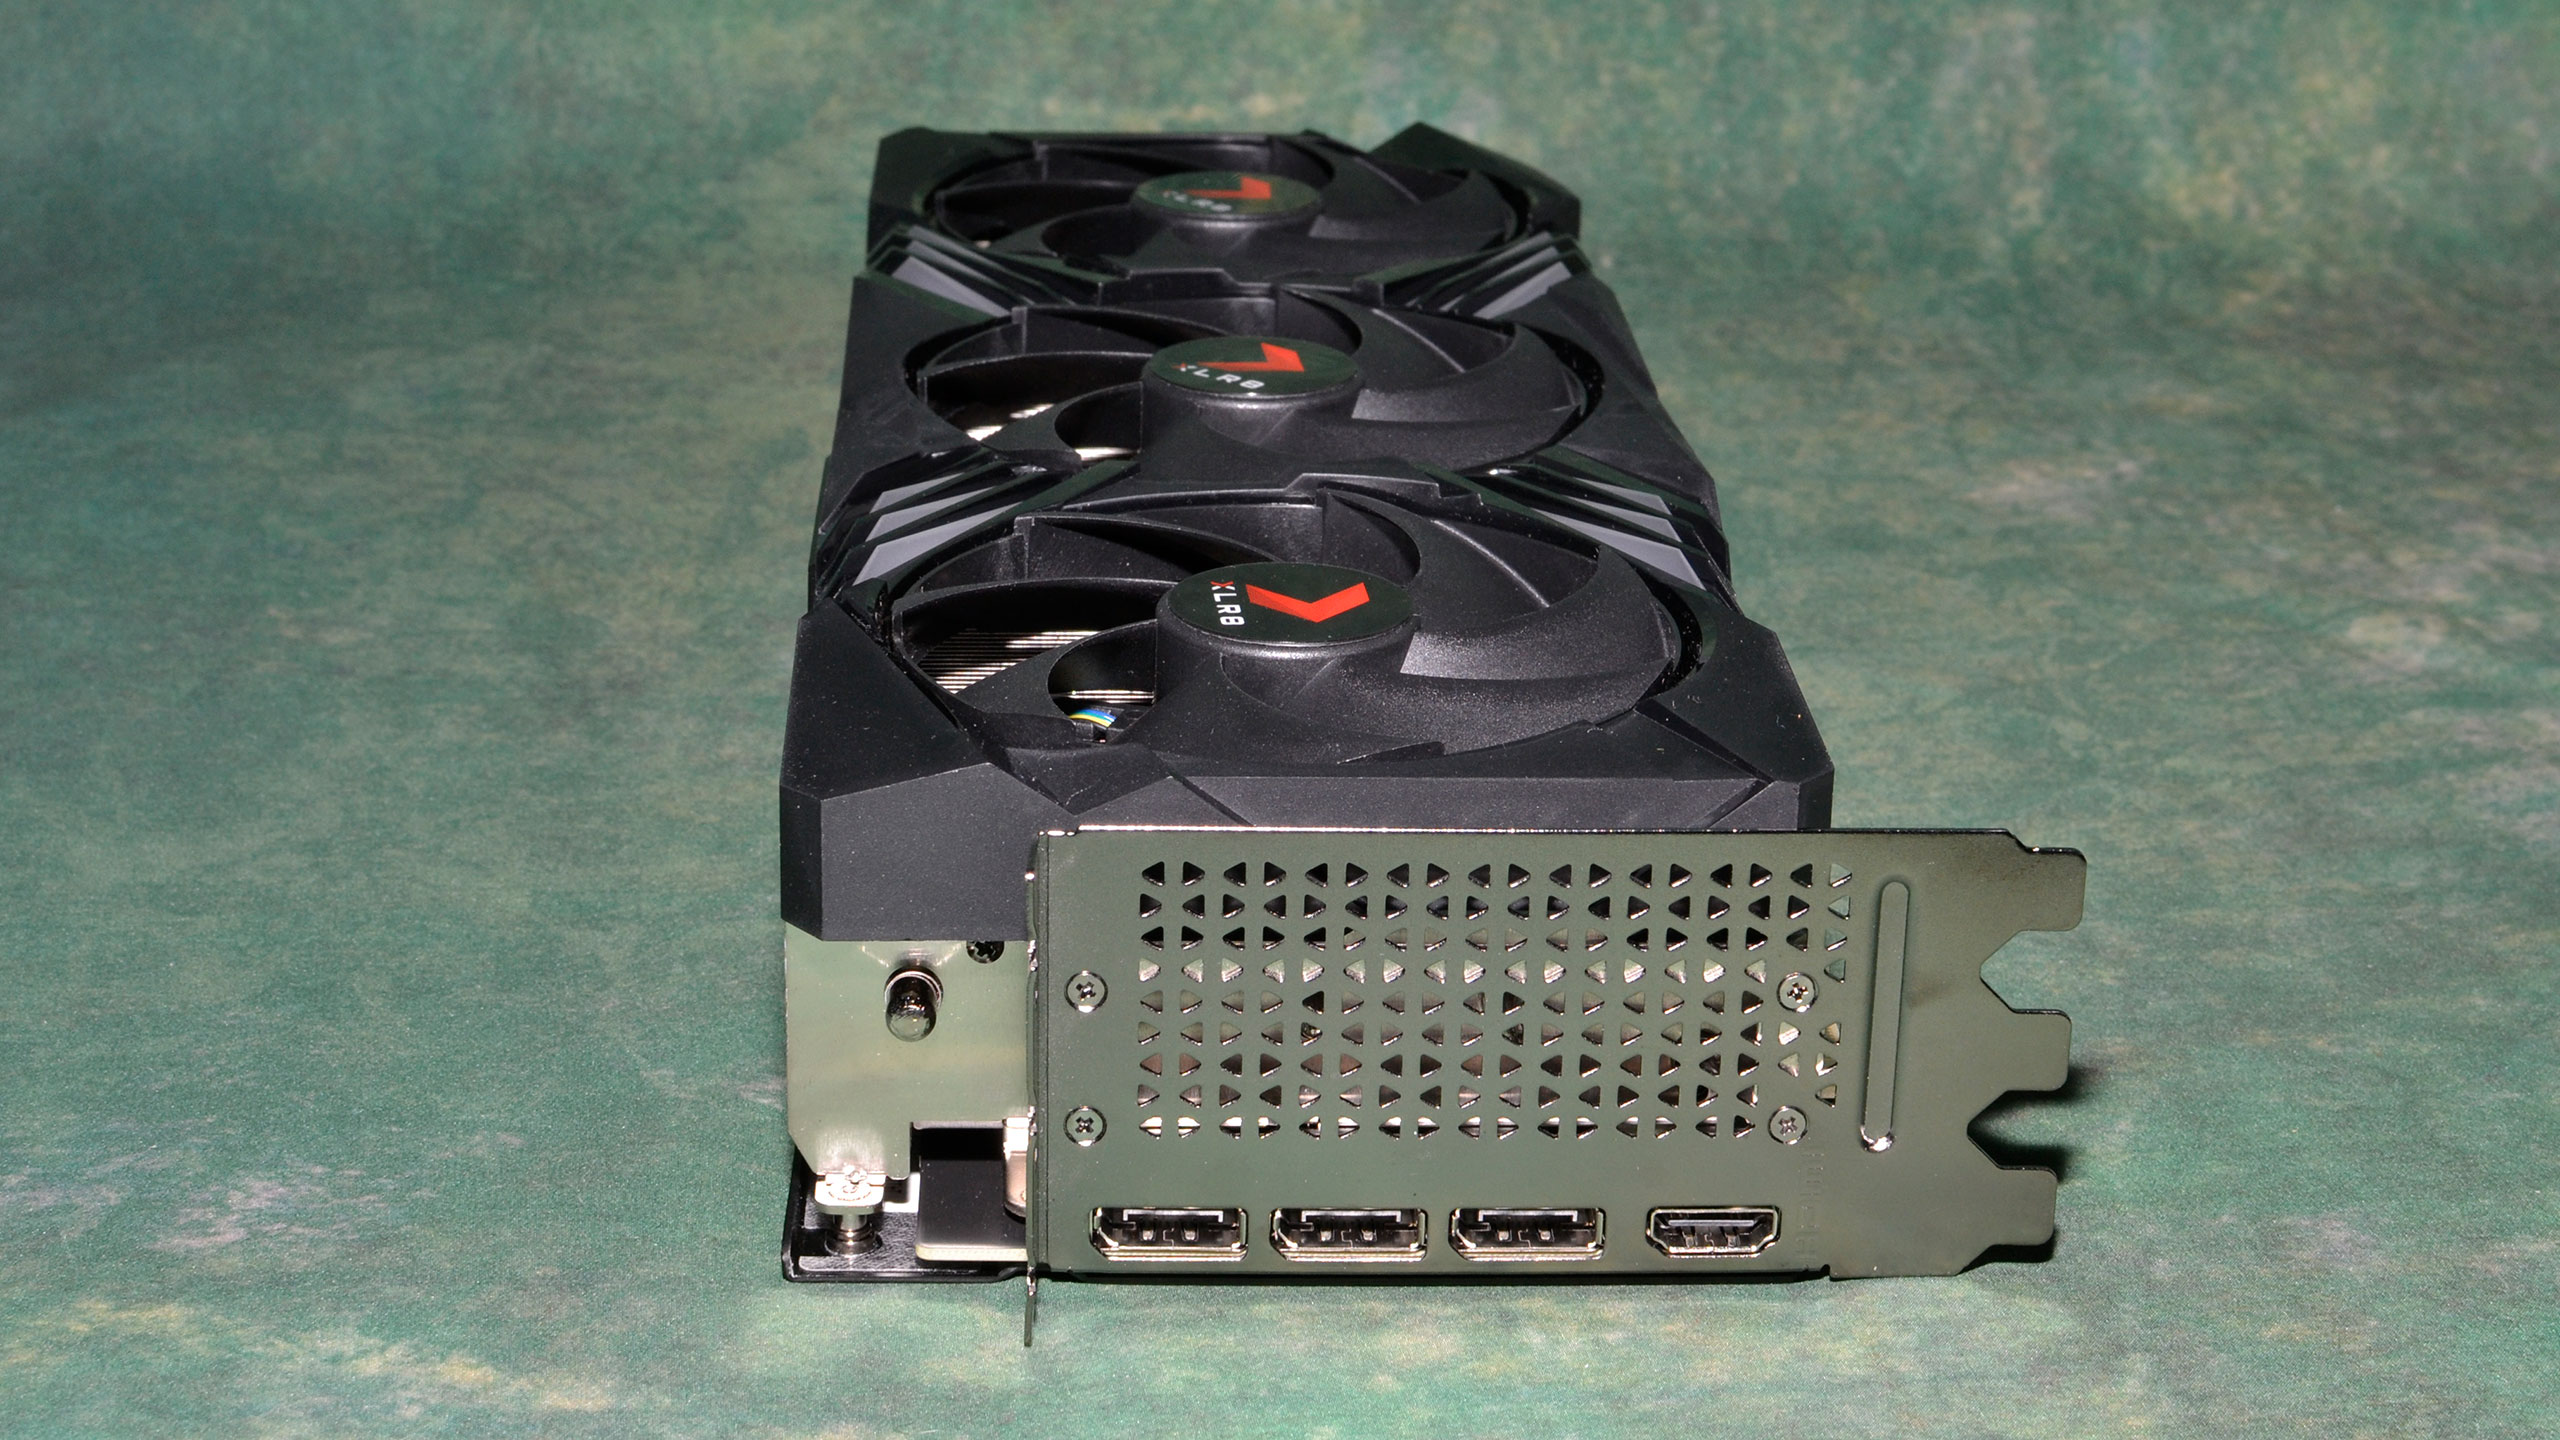
RGB lighting on the card consists of two main areas. There’s a large “X” on the front of the card that lights up, and then there’s an XLR8 logo on the top of the card. Both can be controlled by PNY’s Velocity software, or left to their default color cycling behavior.
The only extra in the packaging consists of a support stand — not one of the simple pre-assembled models. The stand does work, but it’s not quite as convenient as other solutions, with discrete heights that can be set via the various screw holes, and then a slider on the small support bracket for finer adjustments.
PNY sticks with the usual triple DP1.4a ports and a single HDMI 2.1 output for the display options. All outputs can support up to at least 4K and 240 Hz with HDR, using Display Stream Compression.

Here’s a quick comparison photo of the two RTX 4070 Ti Super cards we’ve tested. The PNY card on the right looks longer and thicker, but the two are actually close to the same thickness — it’s just the extra length making it look thicker. We do like the inclusion of a full 3-slot IO bracket for added support of the card, since it blocks the use of all three expansion slots, though for cases with vertical mounting options sometimes it’s better to have a 2-slot bracket. (Most cases that have a vertical mounting option don’t have a 3-slot cutout.)
PNY RTX 4070 Ti Super Verto OC Test Setup

Our current graphics card testbed has been in use for over a year now, and so far we haven’t seen any pressing need to upgrade. The Core i9-13900K is still holding its own, and while the i9-14900K or Ryzen 9 7950X3D can improve performance slightly, at higher resolutions and settings we’re still almost entirely GPU limited — though perhaps not when the future RTX 50-series and RX 8000-series arrive.
We’re using the same preview drivers from Nvidia, version 551.15, for our testing (which was done in advance of the 4070 Ti Super launch). In our 4070 Super testing, we noticed some changes in several of the benchmarks and retested the Nvidia cards in the affected games. We’ve also retested AMD’s GPUs using the 23.12.1 drivers. The most impacted games are Borderlands 3, Far Cry 6, Forza Horizon 5, Microsoft Flight Simulatorand Spider-Man: Miles Morales. We’ve also fully retested the RTX 4070 and RTX 4070 Ti.
Since this is a third-party post-launch review, we’ll omit the extra testing that we conduct on launch cards, focusing just on gaming performance, cooling, and other aspects of the cards. We’ve included eight other GPUs from AMD and Nvidia as reference points for this review, and we’ll highlight the Asus and PNY cards in the charts.
Our current test suite consists of 15 games. Of these, nine support DirectX Raytracing (DXR), but we only enable the DXR features in six games. The remaining nine games are tested in pure rasterization mode. We don’t enable upscaling on any of the cards for our primary tests, and we run 1080p (medium and ultra), 1440p ultra, and 4K ultra benchmarks — ultra being the highest supported preset if there is one, and in some cases maxing out all the other settings for good measure (except for MSAA or super sampling).
Our PC is hooked up to a Samsung Odyssey Neo G8 32, one of the best gaming monitors around, allowing us to fully experience the higher frame rates that might be available. G-Sync and FreeSync were enabled, as appropriate. As we’re not testing with esports games, most of our performance results are nowhere near the 240 Hz limit, or even the 144 Hz limit of our secondary test PC.
We’ve installed Windows 11 22H2 and used InControl to lock our test PC to that major release for the foreseeable future (though critical security updates still get installed monthly — and one of those probably caused the drop in performance that necessitated retesting a third of the games in our suite).
Our test PC includes Nvidia’s PCAT v2 (Power Capture and Analysis Tool) hardware, which means we can grab real power use, GPU clocks, and more during all of our gaming benchmarks. We’ll cover those results on our page on power use.
Finally, because GPUs aren’t purely for gaming these days, we’ve run some professional content creation application tests, and we also ran some Stable Diffusion benchmarks to see how AI workloads scale on the various GPUs.


