India’s GDP will grow by 7.3% in the current financial year (2023-24), slightly faster than the 7.2% growth in 2022-23, the First Advance Estimates (FAEs) released by the government on Friday showed.
The FAE are presented at the end of the first week of January every year. They are only the first estimates of growth for that financial year. By the end of February, the Ministry of Statistics and Programme Implementation (MoSPI) will release the Second Advance Estimates and, by the end of May, the Provisional Estimates.
The GDP estimates continue to be revised as more and better data become available — and in the coming three years, MoSPI will release the First, Second, and Third Revised Estimates of this year’s GDP before settling on the final number, which is called the “Actuals”.
The FAE are based on the performance of the economy over the first seven-odd months, and the data are extrapolated to arrive at an annual picture.
“The Advance Estimates of National Income are indicator-based and are compiled using the benchmark-indicator method, i.e. the estimates available for the previous year (2022-23) are extrapolated using the relevant indicators reflecting the performance of sectors,” the official press release said.

If the data are not final, what is the point of the FAEs?
The crucial significance of the FAEs is that they are the last GDP data released before the Union Budget for the coming financial year (which is presented on February 1) is finalised. As such, the FAEs constitute the base for the Budget numbers. However, since Lok Sabha elections will be held in April-May, a full-fledged Union Budget will not be presented this year.
This year’s FAEs draw some additional significance from the fact that they provide the first complete picture of economic growth in the 10 years of the government led by Prime Minister Narendra Modi.
So what do the FAE data show?
The chart shows India’s real GDP (GDP after stripping away the effect of inflation), both in absolute terms (in Rs lakh crore) and in terms of growth rate.
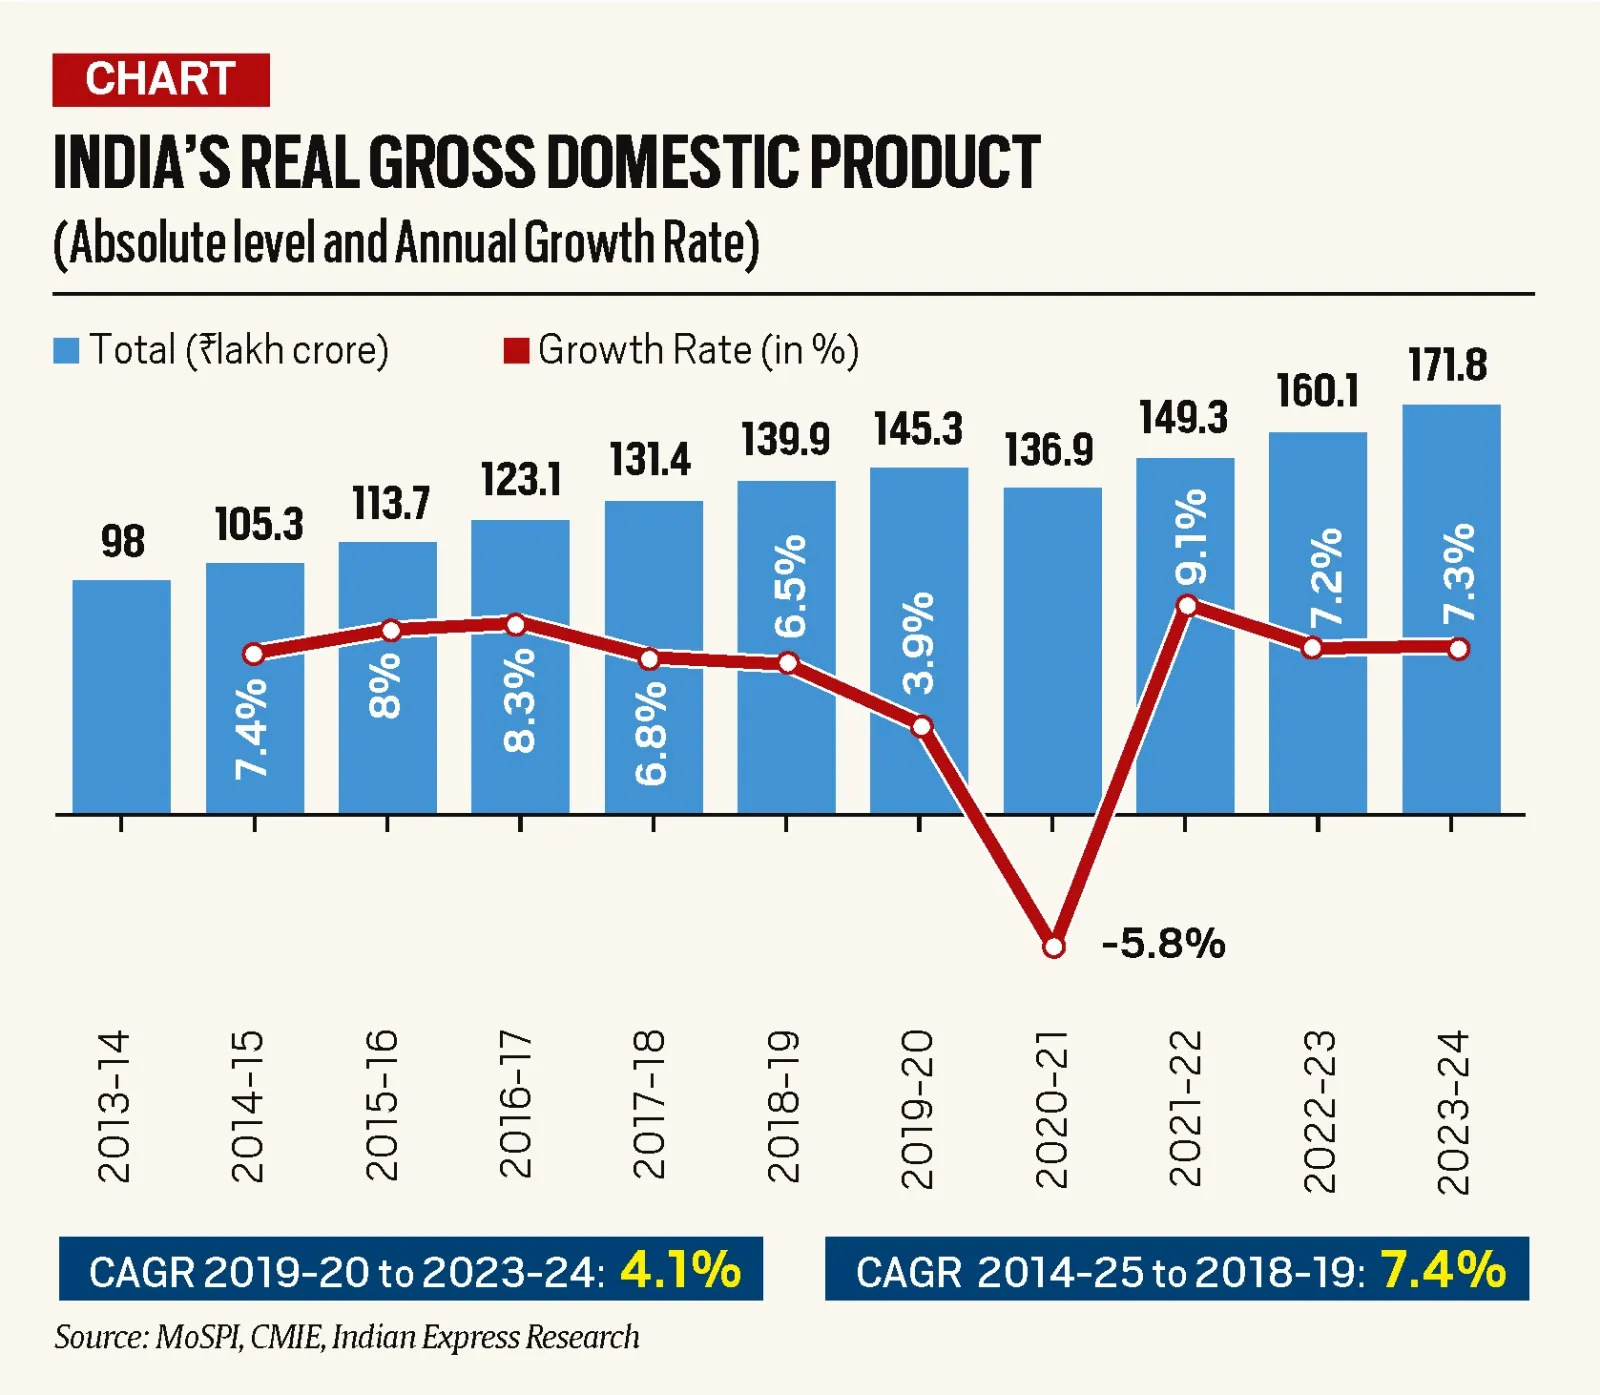

By the end of March 2024, India’s GDP is expected to rise to almost Rs 172 lakh crore. When Prime Minister Modi took charge for the first time, India’s GDP was Rs 98 lakh crore, and it had reached almost Rs 140 lakh crore when he began his second term.
On an annual basis, the 7.3% growth rate estimated for 2023-24 presents a substantial and pleasant upside surprise. Most observers, including the Reserve Bank of India, had expected growth to decelerate in the current financial year to somewhere between 5.5% and 6.5%. That the GDP growth rate is now expected to beat even the higher estimate by almost a percentage point underscores the strength of India’s economic recovery.
However, there is a clear deceleration of growth in the second term of the Modi government compared to the first. During 2014-15 to 2018-19, the Indian economy grew at a compounded annual growth rate (CAGR) of 7.4%; in the second term (2019-20 to 2023-24), it was just 4.1%.
The big reason for this is the poor growth rate in the first two years of the current term of the government. The economy grew by less than 4% in 2019-20 (before the Covid-19 pandemic), and then contracted by 5.6% in 2020-21 (immediately after Covid struck).
Overall, the 7.3% growth rate in the current year suggests an optimistic picture because most of this momentum has little to do with the low base effect that bumped up GDP growth rates in FY22 and FY23.
What is contributing to India’s growth?
India’s GDP is calculated by adding up all kinds of spending in the economy — the demand side of the economy. As such, there are four main “engines” of GDP growth.
*Spending by people in their individual capacity: Technically this is called Private Final Consumption Expenditure (PFCE). It accounts for almost 60% of India’s GDP.
*Spending towards investments in boosting the productive capacity of the economy: This could be the building of a factory, companies buying computers for their offices, or governments building roads. This is called Gross Fixed Capital Formation (GFCF)and is the second-largest engine of growth that typically accounts for 30% of the GDP.
*Spending by governments to meet daily expenditures such as salaries: This is Government Final Consumption Expenditure (GFCE). It is the smallest engine, accounting for around 10% of GDP.
*Net exports or net spending as a result of Indians spending on imports and foreigners spending on Indian exports: Since India typically imports more than it exports, this engine drags down GDP calculations, and shows up with a minus sign.
The table shows how each of these components has done in absolute and percentage terms.
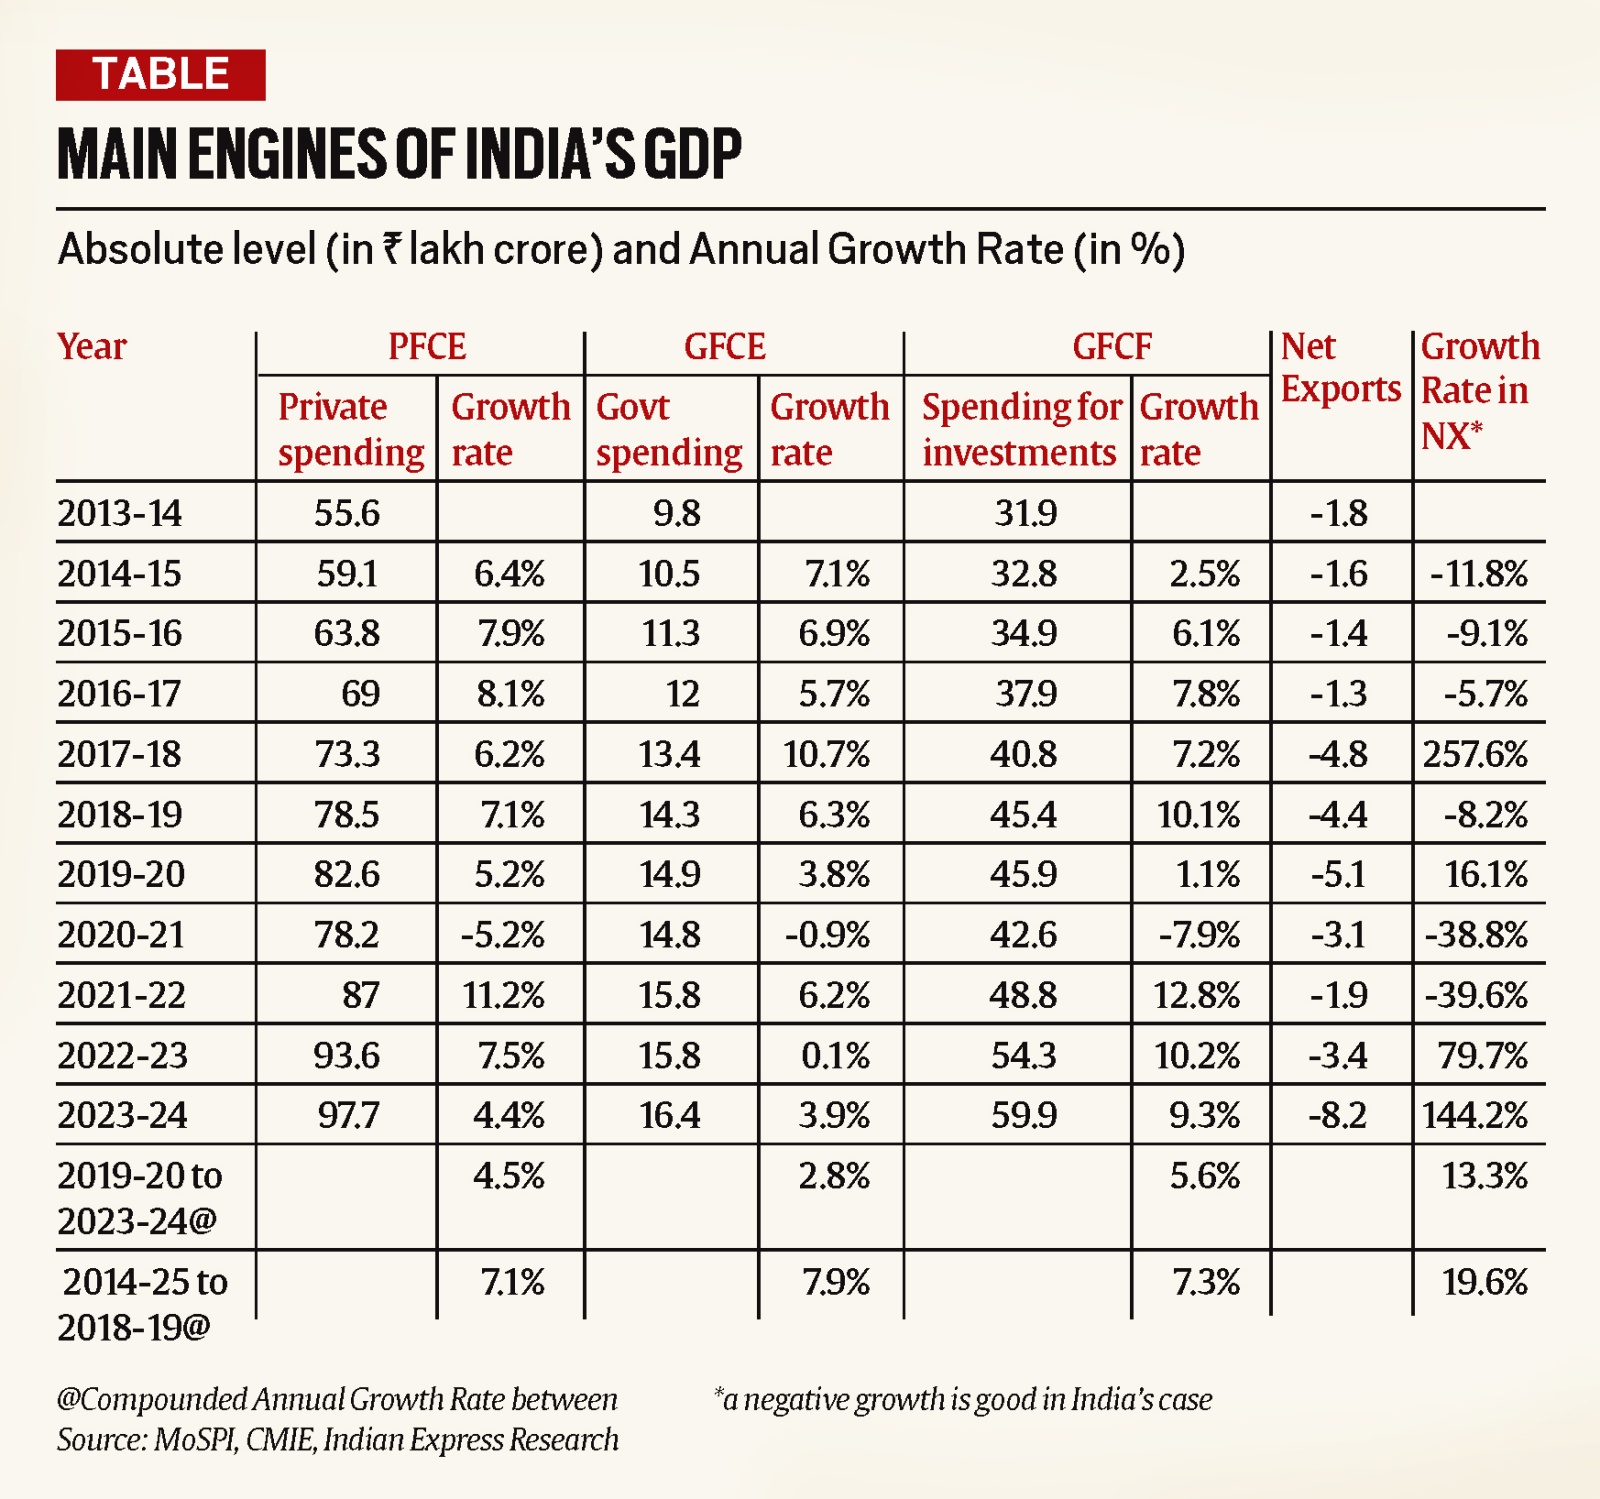

PRIVATE CONSUMPTION DEMAND: In the current year, the overall demand by people is expected to grow by 4.4%. This is similar to the CAGR (4.5%) in the second term of the Modi government but is substantially lower than the growth rate in the first term (7.1%).
Muted private consumption is made worse by growing inequality — consumption in some parts of the economy (say, the urban rich) has grown quite fast while large sections of the economy (especially rural India) haven’t yet recovered enough. While people should not consume more than their income, the muted performance of the biggest engine of growth is a matter of concern.
INVESTMENT SPENDING: A high rate of investment spending is considered a salutary signal for the prospects of an economy because it shows businesses are optimistic about future consumption demand. On the face of it, investments have grown by 9.3% in the current financial year, thus helping to push up the CAGR in the second term (5.6%) closer to the CAGR in the first (7.3%).
However, there are two lingering concerns: one, a large part of the investment spending is still coming from the government and, two, private consumption is still muted.
GOVERNMENT SPENDING: As weak as the growth in private demand has been in the current year, at 3.9%, government spending has grown even slower. Despite the Covid disruptions, government spending has barely grown in the second term. At a CAGR of 2.8%, it is far lower than the CAGR of 7.9% during the first term.
NET EXPORTS: When data for any particular year shows up with a negative sign, it suggests Indians are importing more than they are exporting. As such, negative growth rates here are a good development. For the current year, this drag effect has grown by 144%. However, over the two terms, the growth rate has decelerated from 19.6% to 13.3% — which is a mild improvement.